The following blog is a white paper, written by our CEO Dr. Caibin Xiao, from September of 2016. It details everything you need to know about Fluorescent Tracing in Cooling Water Systems.
© Pyxis Lab, Inc. 2016. All Rights Reserved.
Fluorescent Tracing in Cooling Water Systems.
To accurately measure the concentration of a treatment chemical in cooling tower water has been a challenge. Many reasons account for this challenge. Some are technical and some economical. The active ingredients in treatment products include polymeric scale inhibitors such as AA/AMPS and corrosion inhibitors such as phosphate and triazoles. A reagent-less analytical method to measure these chemicals suitable for an industrial application does not exist. The concentration of these treatment chemicals are commonly measured with using reagent based wet chemistry methods, which are very difficult to be made online for continuous monitoring.
The treatment level in a cooling tower can be alternately determined by the so-called mass balance approach. Theoretically, if the feed rate of the treatment chemical and the cooling blowdown rate are known, the treatment dosage can be calculated. The major disadvantage of the mass balance approaches is that the dosage is deduced from flow rates and may not reflect the actual cooling tower chemical dynamics. Besides, cooling tower blowdown rate may not be available in many systems.
Nalco pioneered the fluorescence tracing technology in the monitoring and control of cooling systems.1,2 After many year research, Nalco discovered a fluorescent chemical PTSA (1,3,6,8-Pyrenetetrasulfonic acid, tetrasodium salt) that can meet stringent requirements as cooling water tracer. Because an affordable solid state sensor can be used to monitor the PTSA concentration in real time, this technology has been increasingly adopted by many water treatment service providers world-wide in recent five years.
PTSA
The major chemical and physical properties of PTSA are listed in the following table. More information about PTSA can be found in references.
| Other Names | 1,3,6,8-Pyrenetetrasulfonic acid, sodium salt (1:4);1,3,6,8-Pyrenetetrasulfonic acid, tetrasodium salt (9CI);Tetrasodium 1,3,6,8-pyrenetetrasulfonate;Trasar23299 |
| CAS # | 59572-10-0 |
| Molecular Formula | C16H6Na4012S4 |
| Formula Weight | 610.43 |
| Appearance | Green fine crystalline powder |
| TSCA | Listed |
PTSA Tracing Applications
Many water treatment service providers blend 0.1% PTSA in their products. With this concentration, 100ppb PTSA measured in the cooling water conveniently corresponds to a dosage of 100 ppm product. PTSA’s fluorescent quantum yield is very high. As little as 1ppb PTSA can be easily analyzed in water samples absent of color and turbidity. Because of ubiquitous color and turbidity and back- ground fluorescence carried over from the makeup source, 30ppb PTSA could be considered as a practical low limit of the PTSA concentration in cooling water applications.
Pyxis Lab® fluorometers can be configured to display the product name and the product concentration in ppm. This overcomes the challenge of converting measured PTSA in ppb to ppm product in the field. Fluorometers having a built-in conversion table makes it possible for a company to provide products containing a different amount PTSA. The benefit of varying PTSA content in different products is its cost effectiveness. It is not necessary to blend 0.1% PTSA to a product if its normal dosage is 500 ppm.
PTSA is an inert tracer. The concentration of PTSA measured with a fluorometer can be used to calculate the theoretical product dosage. Early adopters of this technology were cautious about the usefulness of the PTSA traced product dosage. A variety of verification trials in real cooling tower applications were conducted to compare product doses calculated from molybdate, total phosphate, or polymer measurements with the fluorescent PTSA concentration. Those trials ambiguously concluded that PTSA traces very well the other methods unless the cooling water is under a severe stress condition.
Figure 3 is an example of trial results comparing the product dosage calculated from the measured total phosphate and that calculated from the measured PTSA. The trial was conducted in a large steel mill and the cooling water had 40 to 100 NTU turbidity. The zoomed PTSA trend chart shows the PTSA level change according to an on-off set-point control, narrowing from ± 5 to ± 1 ppm band.

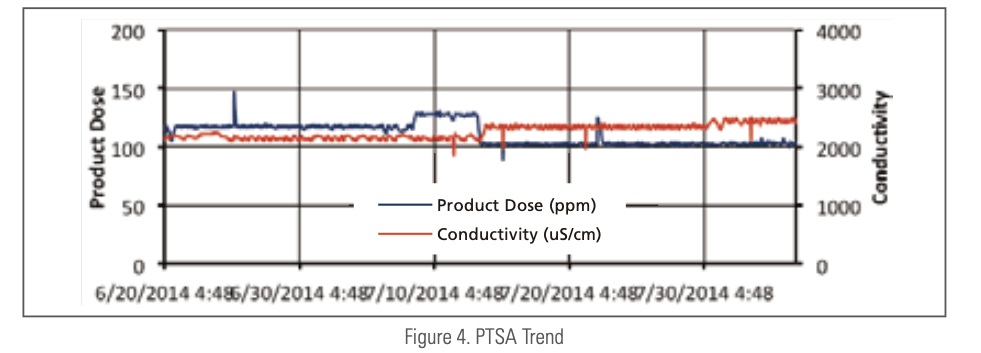
Figure 4 is a trend chart of PTSA concentration in an industrial cool- ing tower. The small step-wise changes in PTSA level responding to the set point and cycle change are clearly seen.
For large cooling towers that can afford more instrumentation, online PTSA monitoring tandem to a wet chemistry based online polymer or phosphate analysis is an attractive approach. How closely the two measurements track to each other could be indication of the system deposition stress.
PTSA for Other Applications
PTSA has been used in tracing treatment products in closed loop systems. A few precautions should be recognized. If the system is treated with nitrite at a dosage above 500 ppm, possible nitrite interference must be investigated. Nitrite absorbs 365 nm light, which is the excitation wavelength for PTSA fluorescence measurement. Fluorometers with a short path-length cell and compensated for absorption loss should be chosen for systems containing nitrite. Another potential problem is color due to a high level of oxidized iron and turbidity in the closed system. Fluorometers that compensate color and turbidity should be used for the same reason as for the case of removing nitrite interference. It is recommended that a spike and recovery study is carried using the real closed loop water sample before switching to a PTSA traced program.
As an alternative to lithium sizing, PTSA has been used to size a water system. PTSA appears to be inert to system metallurgy and not to be absorbed by iron or other deposits in the system. However, the same precautions mentioned above regarding iron color and turbidity should be noticed.
PTSA is not suitable as a boiler tracer. PTSA undergoes hydrolysis at high pH at the elevated temperature.
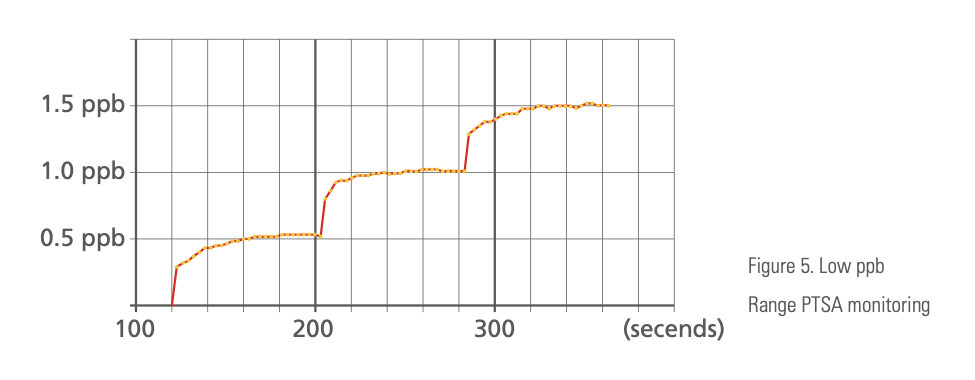
Pyxis ST-500 can be field configured to a high sensitivity mode for the low range of 0 to 10 ppb. This is ideally suitable for monitoring RO feed-water where an ultra-low PTSA level is desirable. Figure 5 is a demonstration of Pyxis ST-500 at its low range mode.
Chemical Interface
The PTSA measurement with using a fluorometer (365 nm excitation and 410 nm Emission) is very robust. Quaternary amines and cationic polymers are only known major chemicals that need to be noticed. They reduce or totally eliminate the PTSA reading. Shot-feeding quaternary amines as a biocide can be seen in a PTSA trend chart as a sharp dip. Automatic product dosing based on the PTSA feedback control should be temporarily disabled during the slug feed period of the quaternary amine biocide or bio-dispersant.
The possibility of cationic polymers carried over from the makeup pretreatment must be examined. Anionic polymers such as AA/AMPS can neutralize the cationic charge and free the cationic polymer from PTSA. A simple test can be carried out to check whether or not PTSA reading is affected by the presence of any quaternary amines or cationic polymers. If the PTSA reading increases significantly after adding a drop of concentrated anionic polymer or polymer containing treatment product in the sample, the interference is likely present.
No known commonly used water treatment chemical affects the PTSA measurement in cooling water. A large amount of dissolved oil and other organic substances leaked to the cooling water from the process side exhibits 365nm/410nm (Excitation/Emission) fluorescence. However, his type of positive interference is rare. Natu- rally occurring substances such as humic acid in cooling towers with a surface water makeup source has week 365nm/410nm (Excitation/Emission) fluorescence. A survival of 24 cooling waters with a surface water makeup before switching to a PTSA traced program found no sample exhibiting greater than 10ppb PTSA as a background reading.
Color & Turbidity Interference
Color and turbidity interference are different from the above mentioned chemical interference. The presence of color and turbidity in the sample can attenuate the excitation and emission light strength, resulting in a lower PTSA reading. Turbidity could on the other hand cause strong scattering the excitation light and cause a positive interference. Cooling water color is usually introduced by a small amount of iron corrosion products, filtering can usually remove both the color and turbidity of the sample. Comparing the PTSA readings in filtered and unfiltered samples can tell whether or not color and turbidity interference is an issue.
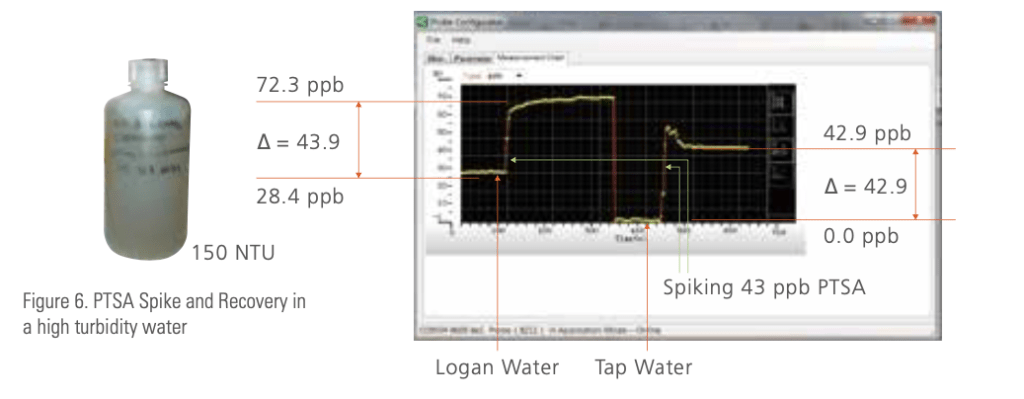
Figure 6 is an example of using Pyxis Lab® ST-500 to measure PTSA in a very turbid cooling water. The water was toke from a cooling tower fed with un-clarified river water and had 150 NTU turbidity on an average. The sample was gently stirred in a beaker and a ST-500 probe was dipped in the water. Initially the PTSA reading is 28.4ppb. A separate test reviewed that the 28ppb PTSA measured consists of about 23ppb PTSA from the treatment at the time sampled and 5ppb due to the makeup background. An aliquot of a PTSA standard was spiked to the sample and the PTSA reading was increased to 72.3ppb as shown on the left of the chart. This means that the recovered amount of PTSA from the spike is 43.9ppb. After that, the probe was moved to another beaker containing deionized water. The same aliquot of PTSA was spiked to the deionized water. The recovered PTSA amount was 42.9ppb, as shown on right side of the chart in figure 6. The spike-recovery percentage of this experience is 102% (43.9/42.9). This excellent spike-recovery result confirms that the Pyxis Lab® ST-500 probe is very accurately in a very turbid water.
Since the initial product launch in 2013, the Pyxis Lab® ST-500 probe has been installed in many systems that have high color and high turbidity water. We have helped many customers to prove that their water can be monitored accurately by conducting a spike recovery experiment before purchasing a probe.
Halogen Stability
PTSA is stable to all oxidizing biocides commonly used in the cooling at the normal application dosage. Detailed PTSA chlorine stability results can be found in many Nalco patents. For example, US Patent 6358476 shows that the PTSA concentration remains unchanged (0% decline) for 24 hours in the presence of 1ppm chlorine or stabilized bromine in a simulated cooling water.
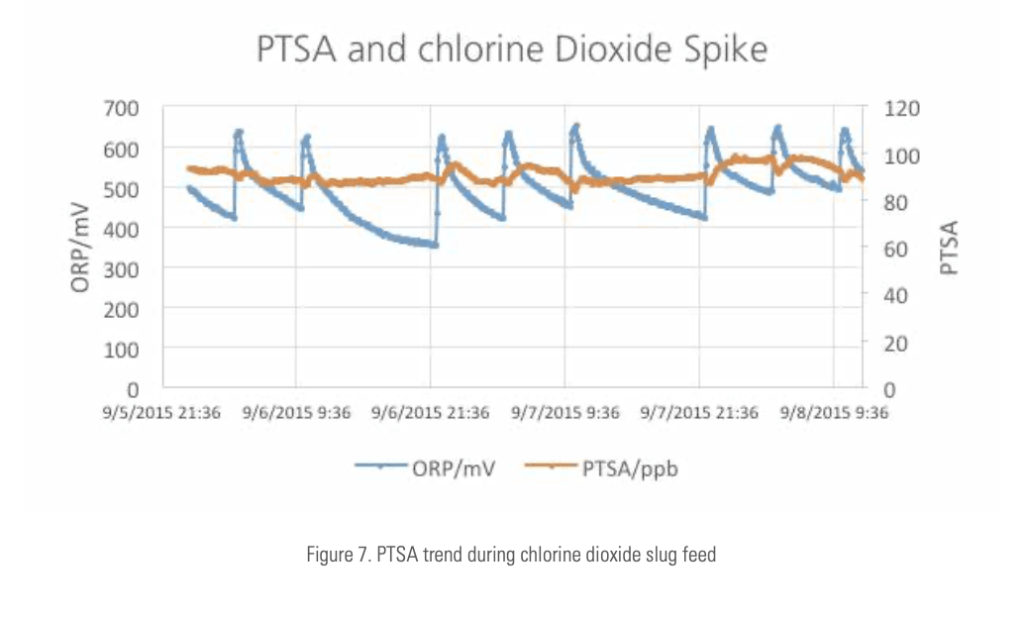
The absence of the monitored PTSA concentration decline during chlorine, chlorine dioxide or bromine slug feed is an evidence that PTSA is not affected by oxidizing biocide in the normal usage range. Figure 7 is an example of PTSA stability during chlorine dioxide shot feeds.
It has been reported that PTSA can be destroyed in the ozone treatment.
Product Formulation
PTSA is available as 10% tetra sodium salt solution or 98% tetra sodium salt solid. Both PTSA sources can be easily blended to a cooling treatment product. For a small batch production, the PTSA solid or the 10% PTSA solution should be weighted accurately (up to at least 1% precision) and added directly to the blending tank. PTSA can undergo hydrolysis to form pyranine (trisodium 8-hy- droxypyrene-1,3,6-trisulfonate), which emits strong green fluorescence light, in a hot alkaline formulation (pH>12). To avoid this, it is recommended that PTSA is added to the product formulation as the last step and after the formulation is cooled down to below 100 ºF.
The solid PTSA is hydroscopic. The commercial PTSA solid product usually comes in double plastic bags sealed in plastic drums. The free-flow and dustless PTSA powder is easy to handle in a typical blending facility. After the original PTSA factory package is opened, the package must be carefully sealed again to avoid PTSA absorbing moisture and causing weighing error for later use.
Conclusion
With help of affordable equipment, inexpensive PTSA source, and application knowledge, PTSA fluorescent tracing technology has been widely adopted worldwide by many water treatment service providers. This paper provides a brief account of practical issues that are faced when a new PTSA traced program is initiated. PTSA is an inert trace. It can accurately indicate the treatment product dosage in presence of major oxidizing biocides. The only major chemical interference is quaternary amines and cationic polymers. Background fluorescence carried over from the makeup is negligible in a treatment programs having a minimal PTSA concentration 30ppb. Color and turbidity interference can be largely removed with using a multi-channel fluorometer capable of automatic color and turbidity compensation. The PTSA solution or solid is nontoxic and easy to handle. It can be blended virtually into any cooling product formulation.
Reference
- Narasimha M. Rao, Frank F. –Y. Lu, John E. Hoots, Method of Monitor- ing and Controlling Corrosion Inhibitor Dosage in Aqueous Systems, 1992, US Patent 5278074. John E. Hoots, Barry E. Hunt, Fluorescent Tracers – Chemical Treatment Monitors, 1987, US Patent 4783314, John E. Hoots, Claudia C. Pierce, Roger W. Kugel, Monitoring and In-System Concentration Control of Polyelectrolytes Using Fluorochro- matic Dyes, 1994, US Patent 5389548.
- Gary Reggiani and Paul Young, TRASAR® TECHNOLOGY – A REVIEW AND COMPARISON, http://go2eti.com/downloads/AWT_Trasar_Pa- per_Final.pdf.
- Raymond M. Post, Steven Davis and Caibin Xiao of GE Water & Process Technologies. Advances In On-Line Monitoring And Control Of Dispersant Chemistry In Power Plant Cooling Systems, Presented at the 28th Annual Electric Utility Chemistry Workshop at The University Of Illinois, May 6-8, 2008.
- Caibin Xiao, Yangang Liang, Li Zhang, Method of Determination of Polymer Concentration in Water Systems, 2007, US Patent 8178353.
- https://pubchem.ncbi.nlm.nih.gov/compound/1_3_6_8-Pyrenetetra- sulfonic_acid
- By R. W. Sabnis, Handbook of Fluorescent Dyes and Probes.
- Fluorescent Compounds for Use in Industrial Water Systems, US Patent 6358476.